A data science project analyzing why/how BLACKPINK has amassed global popularity in the K-Pop scope. Website
Frontend Engineer
May 2020 to Present
Since 2016, K-Pop girl group BLACKPINK has dominated domestic and international markets with their captivating singing, charismatic charms and unique music abilities. Each time they come back with a new project, new records are broken as the group soar past what is commonly accomplished for other kpop girl groups, while reaching new heights and audiences.
After the release of their second studio EP and embarking on their first world tour, BLACKPINK became the first girl group to reach #1 on US iTunes in 15 years, since the release of ‘Lose My Breath’ by Destiny’s Child in 2004. They are also the only K-pop girl group with the highest & multiple entries on the Billboard Hot 100 and Albums 200 charts. Besides gaining billions of views and social media interaction on Youtube, Twitter and Instagram each year, they remain the best selling K-pop girl group in the United States and the most streamed girl group on Spotify. In 2020, BLACKPINK released the highest charting girl group album on Billboard in over 12 years, and continue to smash records and top charts all over the world.
After their first world tour concluded, BLACKPINK became the K-pop girl group with the most attended, highest grossing tour in history, with over 470k tickets sold and raking in $56 million. With BLACKPINK’s commercial power and rapidly growing popularity, it begs the question, how did BLACKPINK become so popular and become a trailblazer for contemporary girl groups? Each year since their debut, BLACKPINK have dropped very little music, and often have sporadic releases and promotion periods. For kpop groups this is very unusual, since numerous yearly releases and fan-interaction is a very important piece of the K-Pop formula.
Now, with BLACKPINK’s highly anticipated first full album released, I decided it was the best time to analyze BLACKPINK’s popularity and journey into becoming the biggest girl group on the planet. To understand the groups’ phenomenon, I researched their music, lyrics, videos and metrics, and compared them to other artists and groups. The ‘Pink Effect’ model explains and dissects the global sensation that is BLACKPINK.
The Pink Effect is the phenomenon of BLACKPINK’s numbers, popularity and demand. BLACKPINK are the most famous K-Pop girl group and are currently the most popular girl group in the world, and have risen to global acclaim quickly because of people’s infatuation. They have commercial appeal that ranges from music to brand deals.
BLACKPINK are a girl group who are known for their special and rare music and strong, confident female aura. Because of their infrequent releases, people ask why BLACKPINK is so popular with little music. I can chalk this up to my personal reasons as a fan; striking visuals, amazing personalities, captivating girl crush energy, high quality dances and performances, exclusivity in promotion, etc. Of course, these explanations are obviously biased and not supported by scientific evidence. Fortunately, we have data science that can analyze BLACKPINK’s uniqueness and distinctiveness. This project analyzes all of the elements that make up BLACKPINK’s popularity.
All data showcased in this project was collected through authentic sources and reliable databases, and are all credited below.
For each of BLACKPINK’s tracks, I’ve collected each song’s music features according to Spotify’s metrics. The Spotipy API gives musical analysis for each track based on their Audio Features; danceability, energy, key, speechiness, acousticness, instrumentalness, liveness, valence and tempo.
🔉"acousticness": A confidence measure from 0.0 to 1.0 of whether the track is acoustic. 1.0 represents high confidence the track is acoustic.
🔉"danceability": Danceability describes how suitable a track is for dancing based on a combination of musical elements including tempo, rhythm stability, beat strength, and overall regularity. A value of 0.0 is least danceable and 1.0 is most danceable.
🔉"energy": Energy is a measure from 0.0 to 1.0 and represents a perceptual measure of intensity and activity. Typically, energetic tracks feel fast, loud, and noisy. For example, death metal has high energy, while a Bach prelude scores low on the scale.
🔉"instrumentalness": Predicts whether a track contains no vocals. “Ooh” and “aah” sounds are treated as instrumental in this context. Rap or spoken word tracks are clearly “vocal”. The closer the instrumentalness value is to 1.0, the greater likelihood the track contains no vocal content.
🔉"liveness": Detects the presence of an audience in the recording. Higher liveness values represent an increased probability that the track was performed live. A value above 0.8 provides strong likelihood that the track is live.
🔉"speechiness": Speechiness detects the presence of spoken words in a track. The more exclusively speech-like the recording (e.g. talk show, audio book, poetry), the closer to 1.0 the attribute value. Values above 0.66 describe tracks that are probably made entirely of spoken words.
🔉"valence": A measure from 0.0 to 1.0 describing the musical positiveness conveyed by a track. Tracks with high valence sound more positive (e.g. happy, cheerful, euphoric), while tracks with low valence sound more negative (e.g. sad, depressed, angry).

All of the translated lyrics were collected through scraping Genius’ website with Beautiful Soup and analyzed for recurrences and similarity in words with Gensim and AWS.
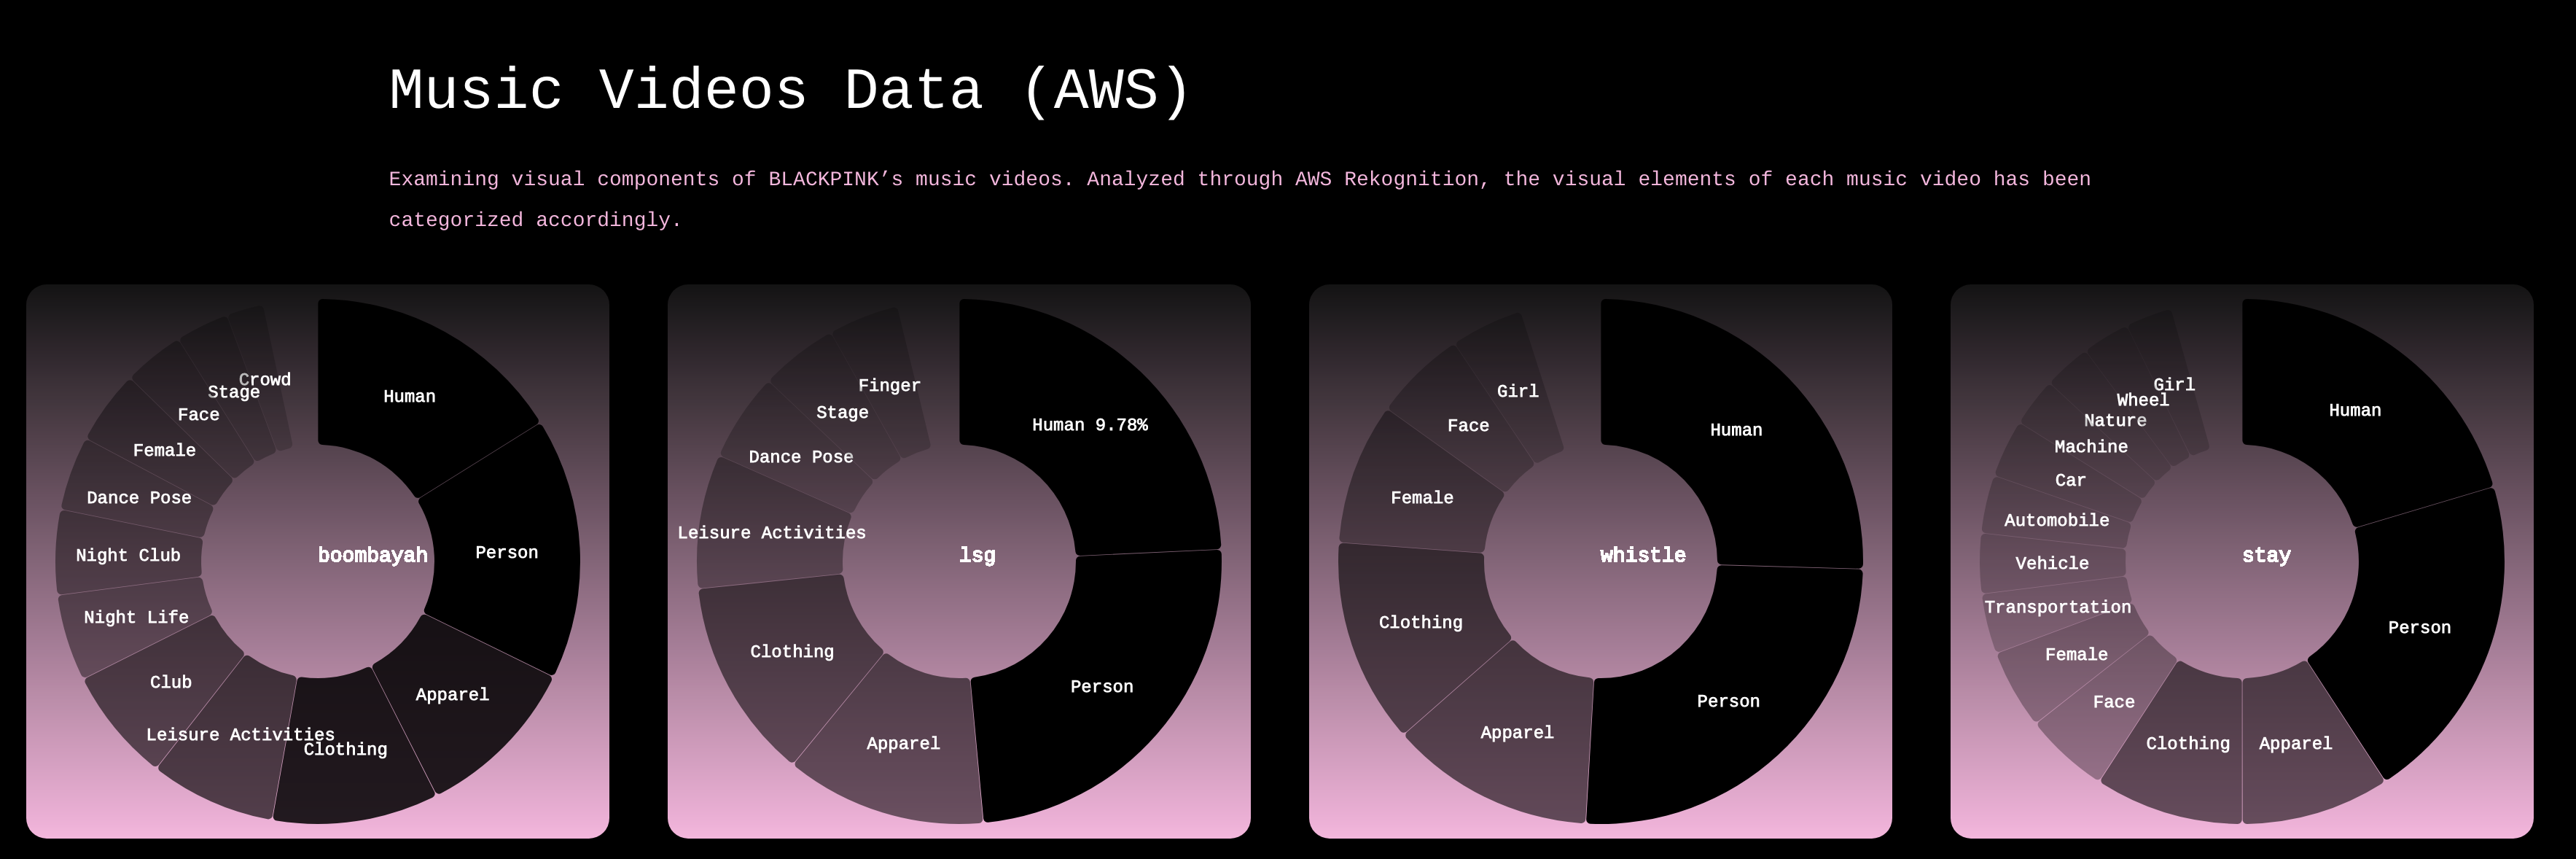
The official music videos were collected from YouTube and analyzed by AWS Rekognition to label each video and study the visual components.
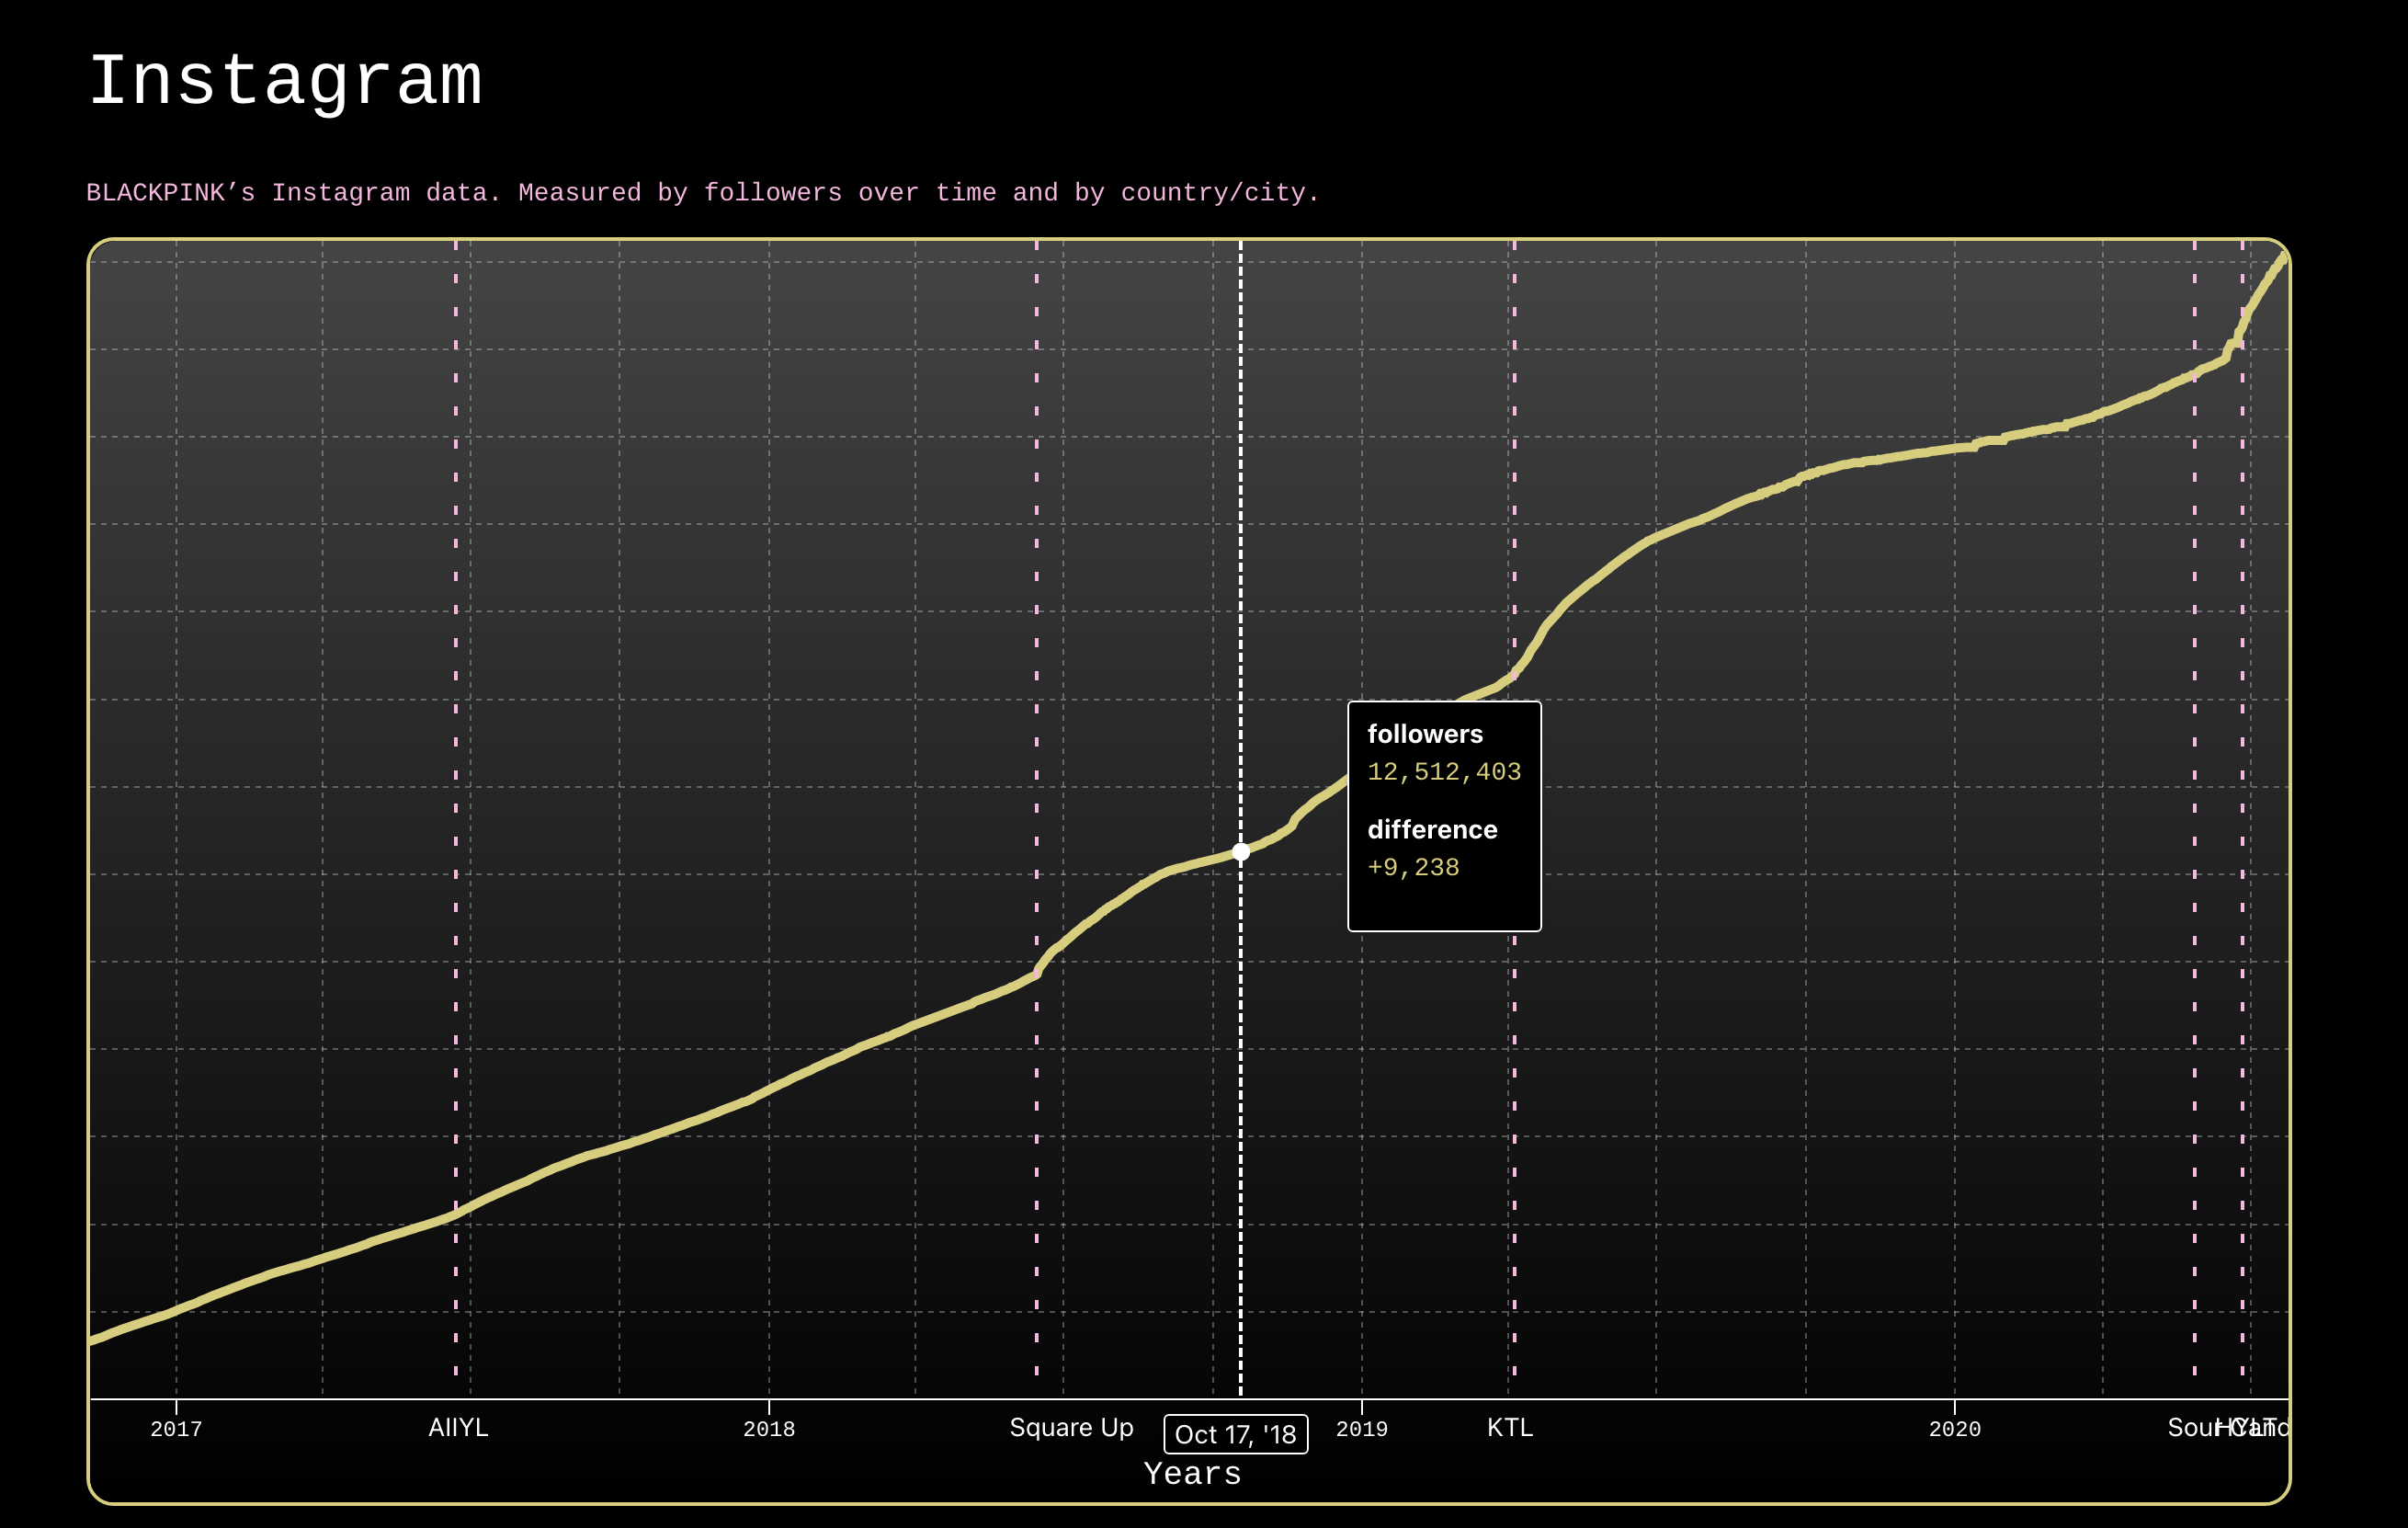
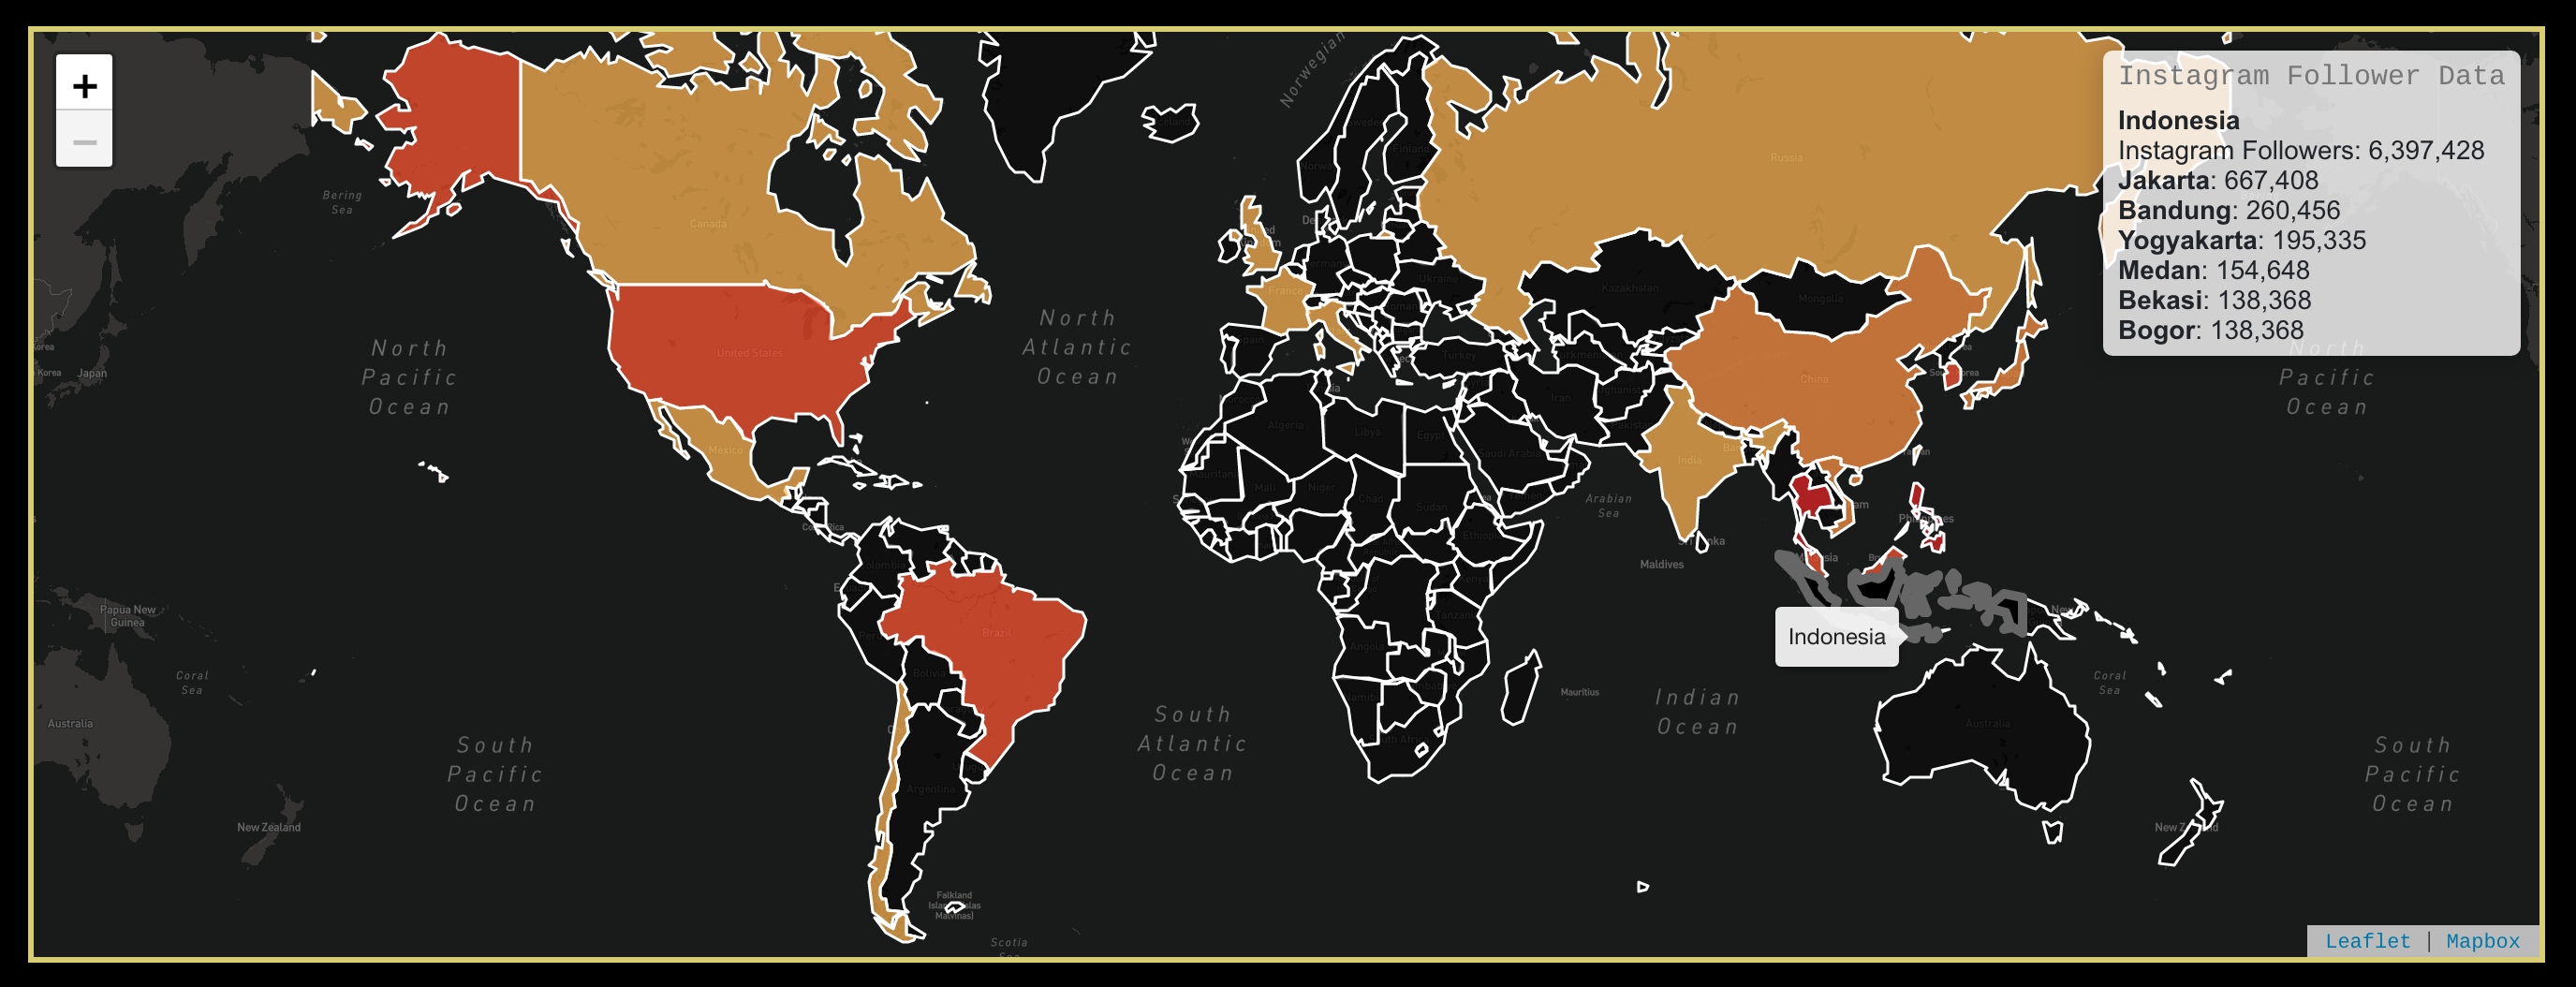
Chartmetric is a music data analytics tool that helps artists, music industry professionals, and data scientists understand music trends, music marketing, Spotify stats, TikTok charts, and so on. Now that the music industry has fully assimilated into the streaming era, it is now more important than ever to understand the figures and metrics that go into charts and artist popularity. Not only does the service provide reliable data, beautiful visualizations and in-depth insights, it also has a REST API that allows any user to access extensive artist data. The Chartmetric API is how I accessed specific analytics on BLACKPINK’s Instagram, Spotify and YouTube metrics, and more.
The Javascript library D3 was used for the graphs and charts, using the wrapper @visx.
The Pink Effect dissects the factors of what makes BLACKPINK popular.
A key point in BLACKPINK’s strategy that many outlets have noticed is that they do not drown their audience in music and content. Each time they release music, it is considered an “event” and that it grabs everyone’s full attention. Each release has a degree of high quality content and a certain aesthetic.
First, to analyze the music tracks, I used the Python library Spotipy. Spotipy is the python library for the Spotify Web API, which allows users to access all music data provided by the Spotify platform such as audio features, streams, and track data. I gathered all of BLACKPINK’s music track by track, first collecting all the music from their two EPs, one studio album, all their singles and collaborations. From each of these tracks I was able to get the audio features and data from each track and loaded all the data into a CSV file. Now to properly investigate this data, I couldn’t just look at BLACKPINK’s music. I wanted to compare their music to their peers and see how they stack up, so I also collected the data of other K-Pop groups and western artists to see the differences and similarities in music. You can see the breakdown of all the tracks below.
I’ve collected this data and showcased it on a website that shows all the stats together.